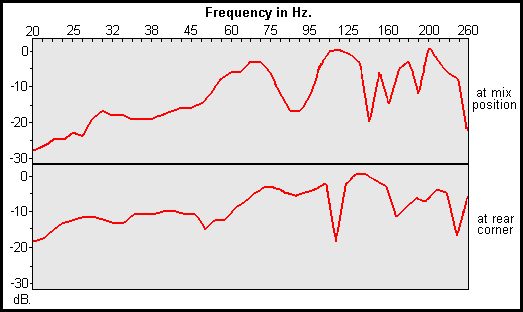
On Saturday I ran a pink noise experiment out my monitoring speakers and into a microphone at my listening position. I then analyzed the recorded signal using a Waves analyzer.
It's definitely not a straight line; but what sort of peaks and dips are considered excessive?
Thanks, Alex
Alex,
The average ear is sensitive to amplitude variations on the order of 1dB. Trained ears are even better.
That said, however, the situation probably is not quite as bad as your data might indicate. The measurement you did was steady state, and it convoluted the direct sound from the monitors (prior to any reflections) with the ambient sound of the room.
It's important to make the distinction between direct and ambient response because your brain has the ability to distinguish these to a certain degree. And your brain considers the direct signal as the most important when determining the timbre and spatial information about what you're hearing. The smaller the room and the earlier the reflections, the less this distinction can be made.
Ideally, the ambient sound should be flat as well, and you should definitely try making it that way as much as possible. But don't get too discouraged if your measurement is far off from this right now. Your measurement technique doesn't fully account for the way your brain perceives sound information.
Thomas
Thanks Thomas.
In hind sight I've begun to question my signal chain a bit too; though the mic I used seems to have a pretty flat frequency profile; can't be too sure about my monitors or A/D converters.
I'm thinking I'll do a few sine wave tests at fixed frequencies as well. I'm sort of at a stage where I'm trying to figure out where I'm at and how much farther I want to go--I've got loads of material but I just don't want to overshoot.
Alex
Alex,
> It's definitely not a straight line; but what sort of peaks and dips are considered excessive? <
Here are a few factors to consider.
Pink noise may not reveal the low frequency problems as well as sine waves, so your low end response is likely worse than you measured. With pink noise, no one frequency lingers long enough for static interference patterns to stabilize. That said, you'll never get a typical small room to have a flat response. If you can get the room flat to within 6 dB you'll be lucky. And, believe it or not, that's actually good enough to mix accurately if the Q of the peaks and dips is not too high.
> can't be too sure about my monitors or A/D converters <
Mikes and speakers are mechanical devices so they're never perfectly flat either. Add to that the complication of directionality - a speaker or cardioid mike may be flat to direct sound, but never off axis. However, your A/D convertors are surely much flatter than your mikes, speakers, or room.
--Ethan
Thanks for your thoughts Ethan. I'll have to relook at my plots, but I think I may be within 6 dB, and the profile is pretty jagged--no fat Q's.
I do need to do some additional testing on the low end I'm sure--if for nothing else than I doubt the 5-in or so drivers on my monitors are capable of delivering much below 150 Hz. When doing sine wave testing should all tones be at an equivalent level (e.g., -0.5 dB) to search for peaks and valleys; or would I need to adjust based on frequency to get an accurate idea?
Alex
Pink noise may not reveal the low frequency problems as well as sine waves, so your low end response is likely worse than you measured. With pink noise, no one frequency lingers long enough for static interference patterns to stabilize.
I have to disagree with you on this one Ethan. As long as you collect about 10 periods worth of data for the lowest frequency of interest, a pink noise signal will yield the same response curve as a swept sine wave. So, for response down to 20Hz you would need to analyze the spectrum of at least 0.5 seconds of data. A longer measurement will average even better, and 2 or 3 seconds of pink noise will yield very good data down to 20Hz - assuming the other aspects of your measurement technique are good.
Thomas
Hello Barefoot,
I 100% agree with you.
Explained it extensively to Ethan only few days back.
Doesn't make any difference if the whole world disagrees with him.
Best regards
Eric
For Once (again) I agree with barefoot and Eric D.
I have been noising rooms since 91 and have found it to be quite accurate. (Back when I was a live engineer and a budding studio engineer that knew enuff to even up rooms)
And I should add, rooms that are built correctly. People have tried to do that with poorly built (acoustically) rooms and get disastrous results. I Learned better when I first got started. (Old school cat taught me well)
We use white eq's and Goldline RTA's for noising studios (here in Detroit)
Rethink your position Ethan. I am a youngin (33) in comparison to you guys but in my 22 years in this biz I have learned a lot of what to do and what not to do.
Yeah I started at 11. Building Speakers (Barefoot) Amplifiers, etc... Electronics and playing keys was my 1st love till I got introduced into to mixing and recording sound. Did a Radio broadcast back in the mid 80's and early 90's, yeah we used 1/4" and 1/2" to edit. I do not miss the days of Cut/splice/ Oops!!!!! (Yah know what I mean)
I was exposed to all of this in my church. By age 14 I was the #2 sound guy in the church. I knew all the tech stuff, just didn't know how to hear (styles of music to mix)
It has been a wonderful journey. It is wonderful to hang around tech heads. I guess you could say I spent so many years studying theory (from 11 to 25) that when I jumped ship I refused to get so caught up in it. So as much as I scream practicality, I have a personal reason for not belaboring theory.
I was SOOOOOOO theoretical it hindered my ability to mix. I had to throw out my Love of theory and embrace creativity to learn how to hear a mix.
As time went on, I revisited theory and now I am mature enough to know how to balance theory and practicality.
So Yeah!!! for John for being practical (balanced with theory) and yeah the rest of you cats for being SOOOOOO theoretical. (No shots intended)
Bryan Giles
It's not just a matter of practicality versus theory. Noise based measurements are completely supported by theory as well.
The simplest way to look at it is this. The only reason a room (cavity, pipe, or whatever) supports standing waves is because it stores energy. If the room instantaneously dissipated acoustic energy, it would be anechoic and there would be no need to discuss such things as standing waves.
Since the room can store energy all spectrally extended signals, whether they be quasi static like a swept sine wave or time variant signals such as pink noise or impulse spikes, can and do excite standing waves. In the case of pink noise you can sort of think of it as a collection of short sine wave pulses that randomly jump around from frequency to frequency. Each pulse stores up energy and decays. Pulse frequencies that corresponded to room modes will decay more slowly. As that energy is decaying another pulse will eventually occur in the same frequency vicinity, exciting the room mode once again. Eventually this continuous excitation and decay will average out to the same frequency response that would be obtained with a swept sine wave.
And remember, a swept sine wave is really just a continuous distribution of pulses as well. The only difference between it and noise is that the sine wave pulses progress in time in a slow, ordered, and coherent manner.
Thomas
Thomas,
> As long as you collect about 10 periods worth of data for the lowest frequency of interest, a pink noise signal will yield the same response curve as a swept sine wave. <
A swept sine wave suffers the same limitation as pink noise, for exactly the same reason. What I am advocating is static sine waves. I am not an expert in noise theory, but from what I've observed no single cycle lingers long enough for standing waves to develop. That is, if you examine a filtered band of noise on an oscilloscope you'll see half a cycle of 51 Hz and then some part of a cycle at 48 Hz, and so forth, all sort of fading in and out. When this issue came up in my forum last week I asked Eric if he knows how many cycles it takes for a static interference pattern to develop in a room when excited by a sine wave. So far he hasn't answered. When this is known, the current question will be answered.
More to the point, and as absolute empirical proof of what I'm saying: Two days ago I measured the response in my living room using a pink noise source, a high-quality omni condenser mike, and a hardware spectrum analyzer I designed and built many years ago. (The analyzer schematic and an article describing its construction are on my personal site if anyone cares.) Relative to 1 KHz, the response was within 2 dB all the way down to 63 Hz, and was down another 1.5 dB at 50 Hz. I assure you that if I play sine waves at 1 Hz increments in this room and measure at the listening position, the dips at certain frequencies between 63 and, say, 200 Hz will be far deeper than 2 dB!
But wait, here's even more compelling proof that sine waves reveal peaks and dips in rooms better than pink noise: The real reason pink noise is inadequate is because all of the frequencies within each band are averaged! The fact that several seconds worth of an entire 1/3 octave band are lumped together completely hides the activity at individual frequencies. This is not unlike my objection to using octave data no lower than 125 Hz to assess fiberglass density. There just is not enough detail to tell what's really happening. Perhaps if pink noise were measured over extremely narrow bands, each encompassing just a few Hz each, the peaks and dips would be better revealed. But time and again I have seen that measuring standard 1/3 octave bands does not show nearly as much variation in a room's response as do sine waves.
--Ethan
Alex,
> When doing sine wave testing should all tones be at an equivalent level (e.g., -0.5 dB) to search for peaks and valleys; or would I need to adjust based on frequency to get an accurate idea? <
One way to assess the room is to play 80 Hz and walk around the room. You'll find out pretty quickly where that one frequency varies! Then go to 90 Hz, 100 Hz, and so forth.
Another way is to put a mike at the mix position, connected to a VU meter, and play 80 Hz, then 81 Hz, then 82 Hz, and so forth up to a few hundred Hz, plotting the meter reading on graph paper. Of course, you must leave the sine wave generator volume set the same for all frequencies. This is probably better than the first method because you'll know what actually happens where you sit while mixing.
--Ethan
Ethan,
I really don't want to belabor this point. I just want to make sure we're not spreading misinformation. Not that I claim to be the omniscient god of acoustics, but this is topic concerns a rather elementary and indisputable physical principle.
Transient signals CAN and DO excite standing waves.
Consider a finger plucking a guitar string, a hammer striking a piano string, a mallet striking a kettle drum, etc., etc., etc. Each of these transient events lasts probably on the order of a millisecond, yet they can excite standing waves in the instruments at very low frequencies. Why? Because the initial wave pulse contains a broad energy distribution in the frequency domain.
The "half a cycle of 51 Hz and then some part of a cycle at 48 Hz, and so forth" you described are all transient impulses that represent a band of frequencies - with the ability to excite any resonances for which they have a reasonable overlap.
The world is a lot more complex than simple sine waves. And if we needed sine waves to excite resonant systems, be they rooms or subatomic particles, nothing much would ever happen.
Enough said on this subject I think.
Thomas
And Barefoot, I don't want to belabor my point, but think of it this way. Until theory is used it is impractical, just data to suggest a point.
Now if when that theory is used it fails then we realize the theory is impractical, however if the object is to make the theory useable by "end users" who have no clue what is going on under the hood, just that it works, why do we get bogged down with it.
As I SAID. I was a theory hound when it came to all things audio. But the application was bad because I lacked the practical application of "listen, learn and mix." When I let go of my strong hold on theory and allowed myself to be practical I blossomed and flourished as an engineer. Hence my point. When it is all said and done, let's be practical.
Who cares about your theory if in the end I have no practical solution for my problem. So for me I WILL always bottom line things especially things I have DONE FOR MYSELF.
So I enjoy your theory, but until it is laid out in a simple easy to understand practical manner It's just numbers and data. Like a person who does not understand Latin. Means nothing to them.
Just like Jesus dealt with the Pharisees and Sadducees. They were theoretical followers of the Law, but Jesus came and made it a practical, manageable and liveable thing.
So Once again. I am not debunking theory. If it were not for theory we would not have our practical solutions, but if we continue to glory in theory and not practicality, we err on the side of foolish intelligence.
Nt shots intended, Just my freedom of speech right to verbalize what I think and rebutt your opinions
BTW I think we agree, just from different sides of the same fence.
Peace in the Middle east. :)[/b]
Thomas,
Before I comment, something bothers me in your reply. First you say, "I really don't want to belabor this point" and then later, "Enough said on this subject I think." I am not here to argue for arguing's sake, but I brought up valid points that are worth discussing. If the purpose of this forum is not to discuss acoustics and its theory, what the heck are we here for? You did this once before in the thread "Resonant panel or slot absorber."
In this case I made two points that prove static sine wave tests reveal peaks and dips more accurately than standard pink noise testing. The main point is my empirical evidence that pink noise measured only 2 dB variation in my living room while sine waves will surely show much more severe change. I admit I haven't tried sine waves in my living room, but I'll do that and report here if that's the only way you'll accept my assertion that the dips will be deeper than 2 dB.
The second point, which you didn't address at all, is that pink noise tests always average an entire band. This is a very important reason standard pink noise shows less detail than sine waves. I say "standard" because maybe really really narrow bands would measure the same as sine waves. I don't know for sure, but I am sure that 1/3 octave bands hide a lot of detail.
Regardless of what Eric says, I don't need to be right all the time. I'm here to learn just as much as everyone else. More so, even, because I'm supposed to be a pro at this. :D But it's disheartening and unfair to have three of you say I'm wrong, then I come back with proof that I'm not wrong, and then y'all want to drop it. If my points are wrong, please tell me why! Thanks.
> this topic concerns a rather elementary and indisputable physical principle. <
I absolutely believe in the scientific method. But if empirical testing shows a different frequency response having deeper dips with sine waves than with pink noise, either the theory is wrong or it's being applied incorrectly.
> Transient signals CAN and DO excite standing waves. <
That's not really the issue because acoustic interference happens at all frequencies in all rooms, down to a cutoff based on the room dimensions. Yes, an impulse can excite a room resonance that sustains long enough to be measured. But acoustic interference also occurs at non-modal frequencies, and these will not be excited even though they cause deep dips.
--Ethan
Attached is a screen shot of the profile I got during the test described in the first post. From what I can tell I'm close to +/- 6 dB variant discussed; but if anyone sees an area you think could be corrected please let me know.
Alex
Image not preserved: Room Profile.Mix Position.jpg
Alex,
> From what I can tell I'm close to +/- 6 dB variant discussed <
When I mentioned that variation range I was thinking of sine wave tests, which show more detail and reveal an even worse response than pink noise. But there still may be hope that you measured wrong. :D
When measuring rooms it's important to use a small diaphragm omnidirectional condenser microphone. What kind of mike did you use, where did you put it, what did you use as a pink noise source, and what model speakers do you have?
--Ethan
Pink noise versus sine waves for room response testing
Folks,
I've spent more time thinking about this, and I'm now totally convinced that sine waves reveal much more detail about a room's response than standard 1/3 octave pink noise. I also realize I was probably mistaken that the time needed for acoustic interference patterns to stabilize is a factor. It does take time for a tone to stabilize and reach its final peak or dip value at a given location, which I'll guess is 20 to 50 milliseconds for a small room. But that's not what's important here.
The real issue is simply the resolution of the measurements, and how broad one third of an octave really is. Many of you have already seen the graph below showing the result of sine wave tests in my partner's 16x10x8 foot control room:
Recovered from web.archive.org — originally hosted at http://www.ethanwiner.com/response.gifConsider the range around 160 Hz. At nearby frequencies there are two peaks and three dips, yet when measured using pink noise with a 1/3 octave bandwidth, these variations are lumped together and averaged into a single measurement. And that average measurement is approximately flat! (That is, about halfway between the peak and dip maximums and minimums.)
Again, I can see how extremely narrow-band pink noise testing will reveal as much detail as sine waves. But standard 1/3 octave tests are way too broad to get a true picture of how a room responds to musical notes played by bass instruments.
Can you get a general sense of a room's response with 1/3 octave pink noise tests? Sure, and lots of people do that every day. But music is made mostly of sine waves, not noise (except cymbals), and it's clear to me that the only way to know the true response for bass notes at the mix position is to test each frequency one by one.
As always, comments and/or criticisms are welcome.
--Ethan
Ethan,
I used a Marshall 603S small diaphragm condenser microphone placed at my listening position (close to horizontal) with a pink noise source generated by the Virtual Minirator out through D/A converter on a Digidesign M-Box to a Samson Servo 220 power amp to a pair of passive Roland DS90 monitors.
Alex
Alex,
> I used a Marshall 603S <
That's a cardioid mike, not an omni. I'm not sure how much the measured response will deviate from an omni, but I do know it won't be as accurate. This alone might account for some of the unevenness of your measurements. Maybe someone else here can say for sure exactly how much disparity the directional pattern can introduce.
All the rest of your setup sounds good.
--Ethan
Ethan,
Yeah, my last "shutting off the conversation" comment wasn't too cool. I must have had a hard day in the clean room that day. ;)
I agree that a 1/3 octave measurement might not give enough detail to be very useful in room design, but this is no fundamental limitation of noise based measurements. A sine wave measurement using a tunable 1/3 octave analyzer would have the same lack of resolution. Remember that sine waves can also excite nearby resonances to some degree, so this measurement would also yield the signal integrated under the 1/3 octave peak.
Furthermore, Alex isn't using a 1/3 octave analyzer. He's recording a waveform then putting it thought a Fast Fourier Transform. The frequency resolution depends on the smoothing window and such, but I'm sure that it's much finer than 1/3 octave.
Here's an example that shows how an impulse measurement can yield the same interference information as a sine wave measurement.
We simulate an omni directional source 0.5m away from a large 100% reflective wall. The test microphone is 10m away from the source as shown. The source produces a short pulse. The waveform below illustrates the original pulse plus it's reflection from the wall. The reflection is phase inverted. Its amplitude is also diminished by -1.66dB due to the extra meter it needed to travel.
If we Fourier transform the original pulse we get the results in the first spectral graph. The short pulse has a broad, flat low frequency spectrum flowed by higher frequency ripples. This is simply the characteristic spectrum of this particular pulse. A different shaped pulse would have a different characteristic spectrum.
Now comes the interesting part. Now we Fourier transform the entire waveform - the original pulse plus the reflection. The last spectral graph shows the result. What we see is a comb filter superimposed on the characteristic pulse spectrum. The first response dip occurs at 344Hz which has a 1m wavelength corresponding the 1m path length difference between the direct and reflected signal. This is the exact same comb filter effect we would expect to see using steady state sine wave signals. Had we used a shorter pulse with an even broader frequency spectrum there would be no difference at all between the pulse/reflection response and a sine wave response.
[The low frequency roll off in the pulse/reflection spectrum probably has something to do with data windowing and sample size. I'm not an expert on these details of FFT, but I know these sorts of things can be accounted for.]
Alex,
You should definitely use a small omni microphone for this measurement. Also it’s a good idea to record several seconds worth of data for good signal to noise ratio. Then fade the beginning and ending 0.5 seconds of the recording to zero. Analyze the whole waveform including the fades. This will help eliminate high and low frequency anomalies associated with truncating the waveform.
Thomas
Thomas,
> Yeah, my last "shutting off the conversation" comment wasn't too cool. I must have had a hard day in the clean room that day. ;) <
Not a problem. I'm glad we're now back on track discussing the issues.
> I agree that a 1/3 octave measurement might not give enough detail to be very useful in room design, but this is no fundamental limitation of noise based measurements. <
Yes, I realize this now. I should have made resolution the main issue from the get-go.
> Alex isn't using a 1/3 octave analyzer. <
In his first post Alex said, "On Saturday I ran a pink noise experiment" so that's what I was addressing. (And yesterday he said, "pink noise source generated by the Virtual Minirator.")
> Here's an example that shows how an impulse measurement can yield the same interference information as a sine wave measurement. <
Yes, I can see that. Thanks.
--Ethan