First, let me thank this wonderful site for all of its great information.
I'm a third year audio engineering student at the University of Hartford. We recently built two recording studios in the basement level of the engineering building. The rooms are well isolated and have good equipment in them. Where they fall short is that they have been given absolutely no attention regarding acoustic treatment.
I've conducted frequency response measurements in the 'Analog' studio(there is also a 'Digital' studio), as well as transmission loss tests. The tests were done with Room EQ Wizard and by placing a Behringer ECM8000 in several positions in the Control Room. The Control Room suffers from serious comb filtering with a +/- 17 dB response above 100 hz, with a 24/db roll off below that. The roll off is most likely due to the response of the ns-10's. The TL between the rooms is about 17 db reduction with broadband pink noise.
The walls between the tracking rooms are thick and constructed well, but the doors have no seals or weatherstripping of any kind.
I haven't taken frequency response measurements in the tracking rooms yet.
The CR is 30'x12'x9' with the console on the longest wall. Each of the two tracking is about 12'x14'x9'. LxWxH
Currently I am putting together a report on the tests I've conducted to outline our problems, with the intention to make recommendations on treatment methods.
At the moment, my question is about what I can expect as a realistic frequency response and TL after treatment, and what is considered acceptable for a recording studio?
When I take the measurements of the tracking rooms, where should I place the speaker?
Also, do my methods produce an accurate depiction of the room's effect on the frequency response? Should I perform more tests before drawing conclusions?
Thanks in advance,
Robby
What to expect
Originally posted at johnlsayers.com, topic 10310.
isolation for low frequencies of at least 45db of TL below 100hz and at least 70db of mid-high frequency TL.
frequency response in the CR should be as flat (20hz-20khz) as possible around the mix position +/- 2db. at the producer seat or client couch - ideal is flat but unlikely. its most important for the people mixing to get the true values coming out of the speakers. pay attention to early and late reflections, comb filtering, and SBIR.
live rooms - the "unflat" frequency response can add character but ideally should be controlled with variable treatments. in the live room put a speaker in one corner and measure in the opposite corner to get a general view of room modes. then put the measurement mic in a number of other room locations where you're most likely to put people, equipment, and microphones.
one thing to consider - resizing the control room to get a better ratio given the low ceiling height.
Control Room Measurements
	ratio	size	m	sqrt(2)	even	ok
h	1.00	9.00	2.74	1.36	FALSE	FALSE	h-w
w	1.33	12.00	3.66	0.06	FALSE	FALSE	l-h
l	3.33	30.00	9.14	0.77	FALSE	FALSE	l-w (h)
	bolt	ebu	iec	>5%	walker
	TRUE	FALSE	TRUE	TRUE	FALSE

	ax 1st	~note	ax 2nd	~note	ax 3rd	~note	ax 4th
h	62.56	B1	125.11	B2	187.67	F#3/Gb3	250.22
w	46.92	F#1/Gb1	93.83	F#2/Gb2	140.75	C#3/Db3	187.67
l	18.77	D0	37.53	D1	56.30	A1	75.07

	vol	surf	edge	area	T(ms)	r(ms)	Dc
ft	3240	1476	204	360	7.80	452.37	6.75
m	91.75	137.12	62.18	33.45

	rt60	eyring	millington	Fc	Fs	Fc2	davis
	1.41	1.23	1.09	192.36	248.26	260.92	375.33
				~note	~note	~note	~note
				F#3/Gb3	B3	B3	F#4/Gb4

	ratios	diatonic	phidev	modes	df
h-w	1.33	IV	0.20	528	0.29
w-d	2.50	V	0.62
h-l	3.33	oct	1.21
	ratio	size	m	sqrt(2)	even	ok		38%
h	1.00	9.00	2.74	0.34	FALSE	TRUE	h-w	3.42
w	1.30	11.70	3.57	0.08	FALSE	TRUE	l-h	4.45
l	1.90	17.10	5.21	0.03	FALSE	TRUE	l-w (h)	6.50
	bolt	ebu	iec	>5%	walker
	TRUE	TRUE	TRUE	TRUE	TRUE

	ax 1st	~note	ax 2nd	~note	ax 3rd	~note	ax 4th	~note
h	62.56	B1	125.11	B2	187.67	F#3/Gb3	250.22	B3
w	48.12	F#1/Gb1	96.24	F#2/Gb2	144.36	C#3/Db3	192.48	F#3/Gb3
l	32.92	C1	65.85	C2	98.77	G2	131.70	C3

	vol	surf	edge	area	T(ms)	r(ms)	Dc	mfp
ft	1801	919	151	200	6.96	403.98	5.33	7.84
m	50.99	85.34	46.09	18.59

	rt60	eyring	millington	Fc	Fs	Fc2	davis
	1.26	1.10	0.98	215.40	314.70	330.75	375.33
				~note	~note	~note	~note
				G#3/Ab3	D#4/Eb4	E4	F#4/Gb4

	ratios	diatonic	phidev	modes	df
h-w	1.30	°IV	0.22	302	0.52
w-d	1.46	+IV	0.11
h-l	1.90	VII	0.20
	ratio	size	m	sqrt(2)	even	ok		38%
h	1.00	9.00	2.74	0.10	FALSE	FALSE	h-w	3.42
w	1.33	12.00	3.66	0.06	FALSE	TRUE	l-h	4.56
l	1.56	14.00	4.27	0.18	FALSE	FALSE	l-w (h)	5.32
	bolt	ebu	iec	>5%	walker
	TRUE	TRUE	TRUE	TRUE	TRUE

	ax 1st	~note	ax 2nd	~note	ax 3rd	~note	ax 4th	~note
h	62.56	B1	125.11	B2	187.67	F#3/Gb3	250.22	B3
w	46.92	F#1/Gb1	93.83	F#2/Gb2	140.75	C#3/Db3	187.67	F#3/Gb3
l	40.21	D#1/Eb1	80.43	D#2/Eb2	120.64	A#2/Bb2	160.86	D#3/Eb3

	vol	surf	edge	area	T(ms)	r(ms)	Dc	mfp
ft	1512	804	140	168	6.68	387.55	4.98	7.52
m	42.82	74.69	42.67	15.61

	rt60	eyring	millington	Fc	Fs	Fc2	davis
	1.21	1.05	0.94	224.53	336.37	353.53	375.33
				~note	~note	~note	~note
				A3	E4	F4	F#4/Gb4

	ratios	diatonic	phidev	modes	df
h-w	1.33	IV	0.20	257	0.61
w-d	1.17	°III	0.32
h-l	1.56	V	0.04
Thank you for the reply.
I accidentally misled you a bit. The room's have false ceilings, so the effective height is a bit higher. I haven't been able to measure beyond the false ceiling height yet, which is why I haven't included it. I would assume that it is under 12 ft, but this is a guess.
A quick recap, I should be shooting for a TL of <70 dB at 100hz and up, and a TL of <45 dB at 100 hz and below. I should also be shooting for a frequency response of +/- 2 dB at the relevant listening positions in the control room.
Here are the response deviations at 9 different points in the room. Sweeps 1-3 are at the mix position and7-9 are at the 'listener' position, near the back wall. The middle ones are at points in between. All deviations are referenced to a close mic reading of a single NS-10 in the same room with batts of 703 surrounding it. They are the maximum reading between 100Hz and 20,000 kHz
sweep---Positive deviation----------Negative Deviation----------Total
1-----------12 dB------------------------4 dB---------------------------17 dB
2------------5 dB----------------------- 11 dB------------------------- 16 dB
3------------7 dB------------------------ 9 dB--------------------------16 dB
4-----------10 dB------------------------ 9 dB--------------------------19 dB
5-----------10 dB----------------------- 11 dB--------------------------21 dB
6------------6 dB-------------------------8 dB---------------------------14 dB
7------------7 dB------------------------10 dB--------------------------17 dB
8------------6 dB------------------------15 dB--------------------------21 dB
9------------6 dB----------------------- 18 dB--------------------------24 dB
Glenn gave you great advice, though I'd say that +/- 2 dB is unrealistic for most small rooms unless you have a lot of bass traps. Also, NS10s are okay as a secondary reference. But if you're making musical mixing decisions you need speakers that are flat down to at least 50 Hz if not lower. --EthanAt the moment, my question is about what I can expect as a realistic frequency response and TL after treatment, and what is considered acceptable for a recording studio?
Thanks for your input. Your writings have been one of the best resources I've found. The NS10s will be replaced in due time. The budget is only so much so I'm prioritizing all the necessary improvements and first on the list is acoustic treatment.Glenn gave you great advice, though I'd say that +/- 2 dB is unrealistic for most small rooms unless you have a lot of bass traps. Also, NS10s are okay as a secondary reference. But if you're making musical mixing decisions you need speakers that are flat down to at least 50 Hz if not lower. --Ethan
sorry - meant +/- 4db which is basically a standard value for ITU and EBU.
:) It could be useful if both defines a bandwidth.
A +/- value without a bandwidth doesn't say much.
+/- xdB at 1/24 octave is different from +/- xdB at 1/3 octave is different from Fourier analysis at an adjustable resolution of whichever bandwidth.
I applied 1/3 octave smoothing to all of my measurements. Is there a standard smoothing bandwidth? Robby:) It could be useful if both defines a bandwidth. A +/- value without a bandwidth doesn't say much. +/- xdB at 1/24 octave is different from +/- xdB at 1/3 octave is different from Fourier analysis at an adjustable resolution of whichever bandwidth.
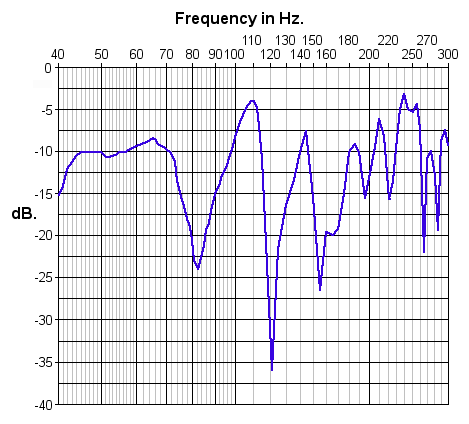
Eric makes a great point. I always measure bass response with a very narrow bandwidth, like 1 Hz wide, because that shows the true extent of the peaks and nulls. Using third octave averaging is okay for large venues like auditoriums, and it's okay for mid and high frequencies in small rooms. But to see what the bass response is like in a control room you need much better resolution that third octaves IMO. The graph below shows the LF response in a typical 16 by 10 foot room. Note the peak/dip pair at 110 and 122 Hz where the response varies a staggering 32 dB across a range smaller than one musical whole step. This is completely hidden when viewed at third octave resolution. --EthanI applied 1/3 octave smoothing to all of my measurements. Is there a standard smoothing bandwidth?
thank you sir!:) It could be useful if both defines a bandwidth.
EBU Tech. 3276 – 2nd edition 2.2. Frequency response The frequency response curve is measured in 1/3–octave bands, with a pink noise test signal. The measurements are taken on the main axis (directional angle = 0°). The curve should fall within a tolerance band of 4 dB over the frequency range from 40 Hz to 16 kHz. Frequency response curves measured at directional angles +10° and +30° should not differ from the frequency response measured on the main axis (directional angle = 0°) by more than the following permissible deviations: +3 dB for directional angles in the range +10° +4 dB +30° Requirements for directional angles of +30° refer to the horizontal plane only