Frequency Profile

How to use REW, What is a Bass Trap, a diffuser, the speed of sound, etc.

Moderators: Aaronw, sharward

Ethan Winer
Senior Member
Posts: 1063
Joined: Fri Feb 21, 2003 3:50 am
Location: New Milford, CT, USA
Contact:

Post by Ethan Winer »

Alex,

> From what I can tell I'm close to +/- 6 dB variant discussed <

When I mentioned that variation range I was thinking of sine wave tests, which show more detail and reveal an even worse response than pink noise. But there still may be hope that you measured wrong. :D

When measuring rooms it's important to use a small diaphragm omnidirectional condenser microphone. What kind of mike did you use, where did you put it, what did you use as a pink noise source, and what model speakers do you have?

--Ethan
Ethan Winer
Senior Member
Posts: 1063
Joined: Fri Feb 21, 2003 3:50 am
Location: New Milford, CT, USA
Contact:

Post by Ethan Winer »

Pink noise versus sine waves for room response testing

Folks,

I've spent more time thinking about this, and I'm now totally convinced that sine waves reveal much more detail about a room's response than standard 1/3 octave pink noise. I also realize I was probably mistaken that the time needed for acoustic interference patterns to stabilize is a factor. It does take time for a tone to stabilize and reach its final peak or dip value at a given location, which I'll guess is 20 to 50 milliseconds for a small room. But that's not what's important here.

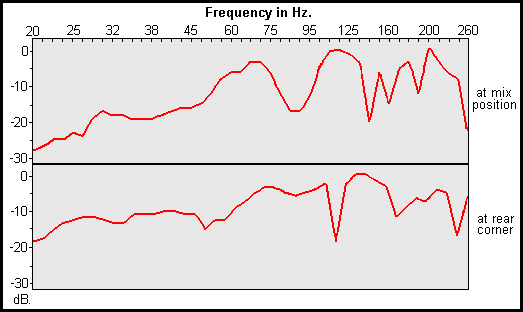
The real issue is simply the resolution of the measurements, and how broad one third of an octave really is. Many of you have already seen the graph below showing the result of sine wave tests in my partner's 16x10x8 foot control room:

Image

Consider the range around 160 Hz. At nearby frequencies there are two peaks and three dips, yet when measured using pink noise with a 1/3 octave bandwidth, these variations are lumped together and averaged into a single measurement. And that average measurement is approximately flat! (That is, about halfway between the peak and dip maximums and minimums.)

Again, I can see how extremely narrow-band pink noise testing will reveal as much detail as sine waves. But standard 1/3 octave tests are way too broad to get a true picture of how a room responds to musical notes played by bass instruments.

Can you get a general sense of a room's response with 1/3 octave pink noise tests? Sure, and lots of people do that every day. But music is made mostly of sine waves, not noise (except cymbals), and it's clear to me that the only way to know the true response for bass notes at the mix position is to test each frequency one by one.

As always, comments and/or criticisms are welcome.

--Ethan
Last edited by Ethan Winer on Fri Aug 22, 2003 5:49 am, edited 2 times in total.
AlexW
Posts: 29
Joined: Sat Aug 09, 2003 7:11 am
Location: Vista, CA

Post by AlexW »

Ethan,

I used a Marshall 603S small diaphragm condenser microphone placed at my listening position (close to horizontal) with a pink noise source generated by the Virtual Minirator out through D/A converter on a Digidesign M-Box to a Samson Servo 220 power amp to a pair of passive Roland DS90 monitors.

Alex
Ethan Winer
Senior Member
Posts: 1063
Joined: Fri Feb 21, 2003 3:50 am
Location: New Milford, CT, USA
Contact:

Post by Ethan Winer »

Alex,

> I used a Marshall 603S <

That's a cardioid mike, not an omni. I'm not sure how much the measured response will deviate from an omni, but I do know it won't be as accurate. This alone might account for some of the unevenness of your measurements. Maybe someone else here can say for sure exactly how much disparity the directional pattern can introduce.

All the rest of your setup sounds good.

--Ethan
barefoot
Moderator
Posts: 554
Joined: Thu Feb 27, 2003 4:49 am
Location: Portland Oregon
Contact:

Post by barefoot »

Ethan,

Yeah, my last "shutting off the conversation" comment wasn't too cool. I must have had a hard day in the clean room that day. ;)

I agree that a 1/3 octave measurement might not give enough detail to be very useful in room design, but this is no fundamental limitation of noise based measurements. A sine wave measurement using a tunable 1/3 octave analyzer would have the same lack of resolution. Remember that sine waves can also excite nearby resonances to some degree, so this measurement would also yield the signal integrated under the 1/3 octave peak.

Furthermore, Alex isn't using a 1/3 octave analyzer. He's recording a waveform then putting it thought a Fast Fourier Transform. The frequency resolution depends on the smoothing window and such, but I'm sure that it's much finer than 1/3 octave.

Here's an example that shows how an impulse measurement can yield the same interference information as a sine wave measurement.

We simulate an omni directional source 0.5m away from a large 100% reflective wall. The test microphone is 10m away from the source as shown. The source produces a short pulse. The waveform below illustrates the original pulse plus it's reflection from the wall. The reflection is phase inverted. Its amplitude is also diminished by -1.66dB due to the extra meter it needed to travel.

If we Fourier transform the original pulse we get the results in the first spectral graph. The short pulse has a broad, flat low frequency spectrum flowed by higher frequency ripples. This is simply the characteristic spectrum of this particular pulse. A different shaped pulse would have a different characteristic spectrum.

Now comes the interesting part. Now we Fourier transform the entire waveform - the original pulse plus the reflection. The last spectral graph shows the result. What we see is a comb filter superimposed on the characteristic pulse spectrum. The first response dip occurs at 344Hz which has a 1m wavelength corresponding the 1m path length difference between the direct and reflected signal. This is the exact same comb filter effect we would expect to see using steady state sine wave signals. Had we used a shorter pulse with an even broader frequency spectrum there would be no difference at all between the pulse/reflection response and a sine wave response.

[The low frequency roll off in the pulse/reflection spectrum probably has something to do with data windowing and sample size. I'm not an expert on these details of FFT, but I know these sorts of things can be accounted for.]


Alex,

You should definitely use a small omni microphone for this measurement. Also it’s a good idea to record several seconds worth of data for good signal to noise ratio. Then fade the beginning and ending 0.5 seconds of the recording to zero. Analyze the whole waveform including the fades. This will help eliminate high and low frequency anomalies associated with truncating the waveform.

Thomas
Thomas Barefoot
Barefoot Sound
Ethan Winer
Senior Member
Posts: 1063
Joined: Fri Feb 21, 2003 3:50 am
Location: New Milford, CT, USA
Contact:

Post by Ethan Winer »

Thomas,

> Yeah, my last "shutting off the conversation" comment wasn't too cool. I must have had a hard day in the clean room that day. ;) <

Not a problem. I'm glad we're now back on track discussing the issues. Image

> I agree that a 1/3 octave measurement might not give enough detail to be very useful in room design, but this is no fundamental limitation of noise based measurements. <

Yes, I realize this now. I should have made resolution the main issue from the get-go.

> Alex isn't using a 1/3 octave analyzer. <

In his first post Alex said, "On Saturday I ran a pink noise experiment" so that's what I was addressing. (And yesterday he said, "pink noise source generated by the Virtual Minirator.")

> Here's an example that shows how an impulse measurement can yield the same interference information as a sine wave measurement. <

Yes, I can see that. Thanks.

--Ethan
Post Reply